MARKET
UPDATE AND COMMENTARY
December 20, 2015
After seven years, the Federal Reserve
finally raised their overnight lending rate a quarter of one percent Wednesday
afternoon (December 11th) and markets initially cheered the move with
US stock markets posting a three-day winning streak culminating Wednesday with
gains of about 1.5% in the major indexes.
Unfortunately, investor enthusiasm vanished on Thursday and Friday as
the major indexes gave back all of the gains early in the week to close the
week with very modest losses.
Time
Period
|
Dow
Jones
Industrial
Average
(DJIA)
|
S&P
500
|
Russell
2000
|
NASDAQ
|
1st Half
2015
|
-1.14%
|
+0.20%
|
+4.09%
|
+5.30%
|
Q3 2015
|
-7.58%
|
-6.94%
|
-12.22%
|
-7.35%
|
Q4 to Date
|
+5.18%
|
+4.45%
|
+1.85%
|
+6.56%
|
Week of Dec 14-
Dec 18
|
-0.79%
|
-0.34%
|
-0.23%
|
-0.21%
|
Year-to-Date
|
-3.90%
|
-2.59%
|
-6.95%
|
+3.95%
|
Source: The Wall Street Journal (Past performance is not
indicative of future returns). As of
market close December 18, 2015.
As the year draws to a close, I suspect
that most investors feel like 2015 has been a real let down after a couple of
good years of gains without much volatility.
My broad explanation of what has happened would necessarily begin with a
discussion about declining oil prices and the devastation of energy-related corporate
earnings. The necessary contraction by
energy companies in response to lost earnings has in turn spread over to other
sectors most notably the Materials and Industrials sector. As of December 18th, the
analytical company, FactSet, estimates that Energy sector earnings will decline
59% in 2015, followed by the Materials (-8%),
and the Industrials (-1%) sectors. The
losses from these three sectors will overwhelm those sectors that have posted
gains to result in an estimated combined decline in profits of -0.5% for
companies within the S&P 500 this year.
While International markets did just a bit
better last week, there has not been much to cheer about abroad in 2015 either.
Time
Period
|
Global
Dow xUS
|
STOXX
600
|
Dow
Jones
Devel
Mkt Region
Total
Stock Market
|
Dow
Jones
Emerg
Mkt Region
Total
Stock Market
|
1st Half
2015
|
+3.22%
|
+11.32%
|
+2.13%
|
+2.09%
|
Q3 2015
|
-12.60%
|
-8.80%
|
-9.09%
|
-19.33%
|
Q4 to Date
|
+2.05%
|
+3.87%
|
+3.11%
|
+1.34%
|
Week of Dec 14-
Dec 18
|
+0.37%
|
+1.53%
|
-0.23%
|
+2.42%
|
Year-to-Date
|
-7.94%
|
+5.46%
|
-4.26%
|
-16.54%
|
Source: The Wall Street Journal (Past performance is not
indicative of future returns). As of
market close December 18, 2015.
I continue to remain less than enthusiastic
about international markets primarily because Europe has shown no ability to
deal with the expansive government domination of most economies (high taxes,
low growth), the influx of refugees, and negative demographic trend (European
families are not reproducing enough children to replace the existing
population). Emerging markets are
suffering from bad governance, the collapse of the commodities markets, and a
strong US Dollar. China brings its own
set of issues as the leadership there continues to devalue the Yuan, provide
unreliable economic data to international investors, and I cannot shake the
feeling that they are building cities in which no one lives. Furthermore, I believe the Chinese economy is
extremely immature in that the government still has too much control over data
reported and tosses money managers it dislikes into jail to highlight just a
couple of problems. However, I believe
facts can change and lead to good investing opportunities. I will never exclude a market in the face of
building momentum, and I have only modestly cut my allocations to developed
markets abroad, but I have not made any new investments there either in the
past couple of months.
Oil is the most significant story in
commodities for the second year in a row.
After the price of a barrel of WTI Oil lost 46% in 2014, it is currently
down another 24% in 2015. I have already
discussed the impact this has had on earnings, but I also believe this
condition will not last indefinitely. As
oil prices have declined, US consumption has increased for the first time in a
number of years. Higher demand is a
natural product of cheaper prices.
Energy production will balance with demand and I believe oil prices will
stabilize. When energy prices stabilize,
the threat of inflation will return because the decline in energy prices has
masked broader inflation in the economy.
Scott Grannis who writes the Calafia Beach Pundit created the chart
below to illustrate this point.
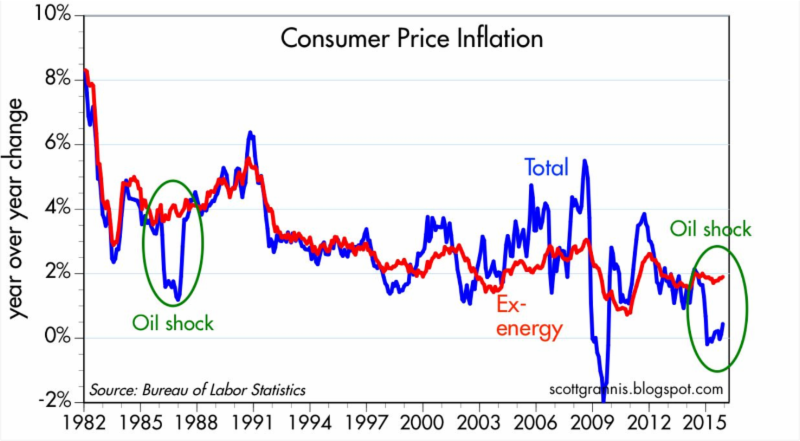
The blue line is reported inflation and the
red line shows what inflation is when the effects of energy prices are stripped
out of the calculation. When oil prices
collapsed back in 1986, you can see how inflation excluding energy maintained
its levels as it is doing today. Assuming
oil prices will find an equilibrium (which I believe they will), the mitigating
impact of falling oil prices will no longer be present and I would expect Total
Inflation (blue line) to return to about 2%.
More on this in the next section.
Before I discuss interest rates and the
bond asset category, I want to remind you that the Federal Reserve controls the
overnight lending rate between banks and the Federal Reserve. It does not control any other rates including
interest rates paid by the US Treasury on its bonds. Traders in the private sector determine all
other rates.
Interest rates in general increased
slightly last week. There has been much
financial media attention to the decline in interest rates Thursday and Friday,
however, I think it is impossible to determine the impact of the Federal
Reserve’s decision to raise the overnight lending rate simply on rates of
Treasuries in the days immediately following the Fed announcement. Until we see more inflation building into the
economy and improving economic growth statistics, I do not believe there will
be much change in rates for the short-term.
The real news in the bond world has focused
on the high-yield bond sector.
High-yield bonds have seen some negative volatility in the past couple
of weeks due to concerns of diminished liquidity (not enough buyers as sellers
enter into the market). Again, much of
the story centers on the energy sector because low oil prices have hurt cash
flows of many smaller companies and fears are increasing that default rates
will increase in the coming months. One
high yield fund manager, Third Avenue Management LLC, suspended redemptions
because they could not sell their positions fast enough to meet cash requests. This announcement sent nervous investors
across the entire sector to the exits hurting many different high-yield
managers. Morningstar®
reports that the high-yield sector has declined 3.5% over the past month and is
now down 4.8% for the year ranking the sector 15th out of the 16 taxable
bond sectors Morningstar® ranks.
Nine other taxable bond sectors are negative as well leaving bond
investors in the same circumstance as stock investors for 2015 facing negative
returns for the first time in a number of years. If you believe that 2016 will be a better
year than 2015, and that energy prices will stabilize as I do, then I believe
the recent sell-off in the high yield bond sector is oversold. However, I will continue to watch this bond
sector very closely going forward.
MORE
ON ENERGY, THE ECONOMY, AND THE FED
Investors cannot look at events in isolation;
the world just doesn’t work that way.
The old kids song, “Dem Bones” that teaches children “the foot bone is
connected to the ankle bone, and the ankle bone is connected to the leg bone,”
and so on is what comes to my mind when I think about how nearly everything is interconnected
in the 21st century and how 2015 evolved.
Oil is a commodity and as such the value of
a barrel of oil is very dependent on supply and demand—economics 101. The more supply you have of something
compared to demand the price will fall.
The opposite is true as well. For
years, the Organization of Petroleum Producing States (OPEC) set the price of
oil by colluding to set production levels to maintain acceptable (to OPEC) oil
prices. As US production of oil
decreased, the US became the world’s largest importer of oil and was thus
vulnerable to OPEC. As a response to the
Arab-Israeli War in 1973, OPEC stopped exporting oil to the United States. This quadrupled the price oil in just a
matter of months. By 1974, gas lines
were common throughout the United States, and OPEC’s power helped push the
United States and Israel to negotiate a settlement with the Arabs that was much
more favorable to the Arabs then would have otherwise happened. In the years following, Saudi Arabia willed
OPEC to maintain oil prices at levels they determined. The cartel worked well until 1986 when Saudi
Arabia decided to punish non-complying OPEC members who ignored quotas by
pumping as much oil as possible, the price of oil plummeted, and the Saudi’s
made their point.
As it has turned out, the 1986 period was
just a precursor of things to come.
Since the mid-1970’s the rest of the world made efforts to break OPEC’s
stranglehold on oil production and prices.
Oil production began or was expanded in countries like Mexico and
Brazil, and exploration began in inhospitable areas like the North Sea and
Alaska. The US passed fuel mileage
legislation and over time, we have become a significantly more fuel-efficient
country. The domination of OPEC on the
world has been broken. However, the Saudi’s
ability to pump large amounts of oil and push the price of oil down has
contributed to the 65% decline in WTI Oil since the end of 2013. The motivation of Saudi Arabia today is much
the same as it was in 1986 and that is to maintain its market share.
The United States has experienced a
revolutionary growth in oil production primarily due to giant technological advances. Proven oil reserves (reachable with current technology) make the US
the largest potential oil producer in the world dwarfing Saudi Arabia. In terms of natural gas, the US has proven
reserves that can last for 700 years.
These facts, I believe, should have a significant positive impact on
life in the US economically and geopolitically.
However, the rapid decline in oil prices has caused short-term
disruptions and I believe we are witnessing the impact of these disruptions
including shutting down rigs, loss of jobs, diminished economic growth in
supporting industries, and the possible bankruptcy of fringe producers. As a practical matter, high-yield bond
investments in this sector and related sectors may suffer a spike in defaults
as the weaker players exit. I believe
these issues are behind much of the recent turbulence in the stock market and
the chart below shows the loose correlation between percentage changes in the
AMEX Oil Index (blue line) and the S&P 500 Index (orange line).
 Longer-term, however, I believe the energy
sector will adapt, adjust, and profit. I
cannot stress enough the importance new technology has had in driving down
production costs. I have read that the
newest rigs are producing oil for as low as $29 per barrel. This allows oil companies to be profitable at
far lower prices than previously thought.
With the United States resuming its place as the largest producer of oil
in the world (and if oil exports are once again permitted), the power of OPEC
will continue to diminish and I believe oil prices will stabilize.
Longer-term, however, I believe the energy
sector will adapt, adjust, and profit. I
cannot stress enough the importance new technology has had in driving down
production costs. I have read that the
newest rigs are producing oil for as low as $29 per barrel. This allows oil companies to be profitable at
far lower prices than previously thought.
With the United States resuming its place as the largest producer of oil
in the world (and if oil exports are once again permitted), the power of OPEC
will continue to diminish and I believe oil prices will stabilize.
What happens when energy prices stabilize? Scott Grannis estimates that the bond market
is pricing in an inflation rate of just 1.25% over the next five years, considerably
below the approximately 2% ex-energy inflation rate currently estimated to be
in the economy today. The connection
between stable oil prices and an increase in inflation could force the bond
market to re-price bonds down to account for higher inflation should it
materialize. Higher inflation could also
lead the Federal Reserve to reevaluate the pace at which it raises interest
rates. Right now markets are generally
expecting the Fed to move in a very deliberate (slow) pace in an effort to
avoid the kind of shocks on the economy that investors dislike. However, if inflation gets going, the Fed may
have to move faster than what investors are thinking and I believe that may be
problematic much as the unexpected size of price declines disrupted the energy
sector. Oil was an important story in
2015 and I believe it will be again in 2016.
LOOKING
AHEAD
The year is limping to an
unimpressive end. Many will soon be
turning their attention to 2016 and what prospects the new year will
bring. I will address 2016 in an
upcoming Update, but for now let’s focus on the near-term.
Most of you are now
familiar with the Dorsey Wright & Associates Daily Asset Level Indicator
(DALI) chart below.

As of December 20, 2015. Source: DorseyWright & Associates.
This chart outlines the most
basic relative strength relationship between the six major asset categories. Since my last Update, there has been no change
in the order of the six major asset categories, but there has been some changes
to the underlying tally scores of each.
Domestic Equities is unchanged both in terms of being the strongest
category and with a tally rank of 341.
Fixed Income (bonds) remains number two, but its tally score fell from
238 to 232 meaning other major asset categories have strengthened slightly at
the expense of Fixed Income. Cash, the
money market sector, tally increased from 205 to 211. International Equities added 3, Currency fell
by 1, and Commodities added 4. These
small changes are notable only for looking at the subtle changes underway in
the markets, however, there is nothing to suggest the need to make any major
adjustments to your portfolios.
As I discussed earlier,
the drop in the High-yield bond sector is notable. If you have a short time horizon the weakness
is important and may justify some changes, however, if you are a long-term
investor, I do not believe wholesale changes in your fixed income allocations
are necessary at this time. However,
further weakness may cause me to change this view. The High-yield sector must be watched closely. The Fed’s raising interest rates a quarter
percent will not, in my view, ease the challenge for investors who require
income beyond the meager interest earned on CDs or money market funds.
One additional comment on the fixed income sector. I mentioned earlier that the fixed income asset category in general has been a disapointment in 2015 with negligible returns at best and a couple of percentage point drop at worst. As we enter 2016 I am searching for signs to see if 2016 will be any better. So far I have not found that evidence. More on this in future Updates as well.
This will be my last
Update for 2015. I hope you and your
family have a warm, loving, and happy holiday season.
Paul L. Merritt,
MBA, C(k)P®, AIF®, CRPC®
Principal
NTrust Wealth
Management
P.S.
If you think this type of analysis would be of benefit to anyone you know,
please share this communication with them.
Past performance is not indicative of future results and there is no
assurance that any forecasts mentioned in this report will be obtained.
Technical analysis is just one form of analysis. You may also want to
consider quantitative and fundamental analysis before making any investment
decisions.
All indices are
unmanaged and are not available for direct investment by the public. Past
performance is not indicative of future results. The S&P 500 is based on the average
performance of the 500 industrial stocks monitored by Standard & Poors and
is a capitalization-weighted index meaning the larger companies have a larger
weighting of the index. The S&P 500
Equal Weighted Index is determined by giving each company in the index an equal
weighting to each of the 500 companies that comprise the index. The Dow
Jones Industrial Average is based on the average performance of 30 large U.S.
companies monitored by Dow Jones & Company.
The Russell 2000 Index Is comprised of the 2000 smallest companies of
the Russell 3000 Index, which is comprised of the 3000 biggest companies in the
US. The NASDAQ Composite Index (NASDAQ)
is an index representing the securities traded on the NASDAQ stock market and
is comprised of over 3000 issues. It has
a heavy bias towards technology and growth stocks. The STOXX® Europe 600 is derived
from the STOXX Europe Total Market Index (TMI) and is a subset of the STOXX
Global 1800 Index. With a fixed number
of 600 components, the STOXX Europe 600 represents large, mid, and small capitalization
countries of the European region. The
Dow Jones Global ex-US index represents 77 countries and covers more than 98% of the world's
market capitalization. A full complement of sub indices, measuring both sectors
and stock-size segments, are calculated for each country and region.
Information in this update has been obtained from and is based upon
sources that NTrust Wealth Management (NTWM) believes to be reliable; however,
NTWM does not guarantee its accuracy. All opinions and estimates constitute
NTWM's judgment as of the date the update was created and are subject to change
without notice. This update is for informational purposes only and is not
intended as an offer or solicitation for the purchase or sale of a security.
Any decision to purchase securities must take into account existing public
information on such security or any registered prospectus.
Emerging market investments
involve higher risks than investments from developed countries and involve
increased risks due to differences in accounting methods, foreign taxation,
political instability, and currency fluctuation. The main risks of
international investing are currency fluctuations, differences in accounting
methods, foreign taxation, economic, political, or financial instability, and
lack of timely or reliable information or unfavorable political or legal
developments.
The commodities industries can be significantly affected by
commodity prices, world events, import controls, worldwide competition,
government regulations, and economic conditions. Past performance is no
guarantee of future results. These investments may not be suitable for all
investors, and there is no guarantee that any investment will be able to sell
for a profit in the future. The Dow
Jones UBS Commodities Index is composed of futures contracts on physical
commodities. This index aims to provide
a broadly diversified representation of commodity markets as an asset
class. The index represents 19
commodities, which are weighted to account for economic significance and market
liquidity. This index cannot be traded
directly. The CBOE Volatility Index - more commonly referred to as
"VIX" - is an up-to-the-minute market estimate of expected volatility
that is calculated by using real-time S&P 500® Index (SPX) option
bid/ask quotes. VIX uses nearby and second nearby options with at least 8 days
left to expiration and then weights them to yield a constant, 30-day measure of
the expected volatility of the S&P 500 Index.
TIPS are U.S. government securities designed to protect investors
and the future value of their fixed-income investments from the adverse effects
of inflation. Using the Consumer Price Index (CPI) as a guide, the value of the
bond's principal is adjusted upward to keep pace with inflation. Increase in
real interest rates can cause the price of inflation-protected debt securities
to decrease. Interest payments on
inflation-protected debt securities can be unpredictable.
The NYCE US Dollar Index is a
measure that calculates the value of the US dollar through a basket of six
currencies, the Euro, the Japanese Yen, the British Pound, the Canadian Dollar,
the Swedish Krona, and the Swiss franc.
The Euro is the predominant currency making up about 57% of the basket.
Currencies and futures generally
are volatile and are not suitable for all investors. Investment in foreign exchange related
products is subject to many factors that contribute to or increase volatility,
such as national debt levels and trade deficits, changes in domestic and
foreign interest rates, and investors’ expectations concerning interest rates,
currency exchange rates and global or regional political, economic or financial
events and situations.
Corporate bonds contain elements
of both interest rate risk and credit risk. Treasury bills are guaranteed by
the U.S. government as to the timely payment of principal and interest, and if
held to maturity, offer a fixed rate of return and fixed principal value. U.S.
Treasury bills do not eliminate market risk. The purchase of bonds is subject
to availability and market conditions. There is an inverse relationship between
the price of bonds and the yield: when price goes up, yield goes down, and vice
versa. Market risk is a consideration if sold or redeemed prior to maturity.
Some bonds have call features that may affect income.
The bullish percent indicator (BPI) is a market breath
indicator. The indicator is calculated by taking the total number of
issues in an index or industry that are generating point and figure buy signals
and dividing it by the total number of stocks in that group. The basic
rule for using the bullish percent index is that when the BPI is above 70%, the
market is overbought, and conversely when the indicator is below 30%, the market
is oversold. The most popular BPI is the NYSE Bullish Percent Index,
which is the tool of choice for famed point and figure analyst, Thomas Dorsey.

