US stocks continued to post gains following the previous week's best-of-year returns, however, markets are fixated on events unfolding in Europe driving investor behavior. We are all aware that the Greek's are going to the polls Sunday, June 16th, and if you believe half of what you read, the entire future of the European Union (EU) is dependent upon that vote. I will add my opinion to this topic in the next section, but there is no question that markets have been reacting moment-by-moment to the headlines coming in from Europe.
The Dow Jones Industrial Average (DJIA) gained 213 points (1.7%) last week pushing the DJIA up by nearly 650 points (5.3%) in the past two weeks. The S&P 500 added 1.3%, the Russell 2000 gained 0.3%, and the NASDAQ added 0.5% last week. Judging by these returns it is becoming apparent, in my view, that investors have been favoring the largest companies over smaller ones recently in a defensive move. For the year, the DJIA is up 4.5%, the S&P 500 is up 6.8%, the Russell 2000 is 4.1% higher, and the NASDAQ leads all major US indexes with a gain of 10.3%.
All major US economic sectors were positive last week led by Telecom, Energy, Health Care, and Financials. Each of these sectors also outperformed the DJIA. Consumer Discretionary followed by Information Technology, and Real Estate led the under-performing sectors. For the year Consumer Discretionary, Financials, and Information Technology are the strongest sectors posting double-digit gains. Energy, Utilities, and Materials have been the weakest with only Energy posting a negative return so far in 2012.
Europe remains under extreme duress and market volatility has picked up. For the week, the MSCI (EAFE) index, with its roughly 60% weighting to Europe, led all major indexes with a 2.2% increase on rumors that the European Central Bank (ECB), along with other central banks, were preparing to swoop in with an enormous bailout package and restore order to the markets. I believe that deep down, many European investors continue to believe a rescue will come, and they may be right. I have said repeatedly in this Update that it is in no one's interest to see the Euro and European Union (EU) collapse under the weight of Greece and related issues. For the year, the MSCI (EAFE) is now down 2.8%. The best performing international region is the Americas which includes the US, Canada, Brazil, Mexico, and four other Latin-America countries. The United States comprises 87% of the index giving further evidence to the strength of the US relative to the rest of the world.
The Euro gained another 1% against the US dollar matching last week's 1% gain to close Friday at $1.264. I believe the movement of the world's currencies is tracking the flow of money out of Greece, Spain, and Italy. The reports coming out of Greece are staggering in terms of the flow of Euros out of Greek banks and to a lesser degree Spanish and Italian banks. The Wall Street Journal reported on Thursday that Greek banking authorities estimate the pace of withdrawals reached between $750 million to $1.1 billion daily this past week. Some of that money is just moving into other European banks, but some is headed here to the US or to Japan helping to strengthen both the US dollar and Japanese yen.
Commodities in general have stabilized over the past two weeks. The Dow Jones UBS Commodity index was flat last week after increasing by 1.6% the week before. Oil prices continue to fall and a barrel of WTI Oil closed at $84.18. The last time oil prices have been this low was back in early October 2011. The Organization of Petroleum Exporting Countries (OPEC) announced last week that they would maintain current levels of production after Iran lobbied to cut production to raise prices on the eve of the Western-backed oil embargo targeting Iranian oil set to begin on July 1st. Lower prices reflect the decreased global demand and growing supply around the world. Gold prices rose $28.20 per ounce to close Friday at $1619.60 an increase of 1.8% from the previous Friday close. For the month, gold prices have climbed 3.4% on growing expectations the US Federal Reserve is likely to endorse some form of additional quantitative easing following a series of anemic US economic reports.
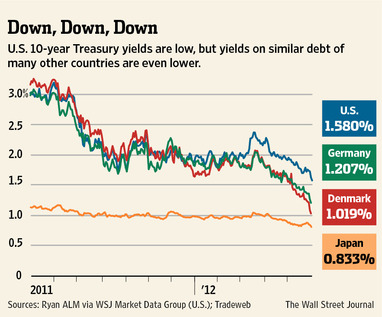
Bond markets here at home have remained on a slight but steady uptrend recently on the strength of US Treasuries. The yield on both 10 and 30-year Treasuries fell again to near historic lows closing Friday at 1.584% and 2.694% respectively. The US Barclays Aggregate US Bond index gained 0.3% last week and is up 2.5% for the year. The real story was in Europe with Spanish debt jumping dramatically last week to close Friday at 6.874%. This increase followed the announcement by the Spanish prime minister that his government had reached a deal for $125 billion in a direct banking bailout from the ECB and EU. Italian interest rates also increased, but at a much slower rate with the Italian 10-year yield closing the week at 5.926%. Most economists see 7% 10-year yields as the point where governments require a bailout. Spain is nearly there and Italy is closing in. Not to sound like a broken record, but I believe the Greek elections will have an enormous influence on these yields and I will be watching closely to see how they move into the new week. For the week, long-duration bond sectors were the best performing sector while short-duration and high yield were the weakest. For the year, preferreds, high yield munis, and extended duration treasuries have been the strongest bond sectors. Short duration and corporate high yield have been the weakest.
EUROPE IS IN TURMOIL
There is no other way to state it-Europe is in turmoil.
Government leaders have spent the last two years dithering as this region has steadily and inexorably drifted nearer and nearer to the edge of a fiscal Niagara Falls. It appears that the tiny and economically irrelevant country of Greece will now help shape the direction of the rest of the EU as voters there decide which direction to take their country. The question for all of us is what will these actions in Europe have on the US?
The first question to ask is what will happen to Greece? Will the country be immediately forced out of the Euro if the left-wing party, Syriza, is elected? Will Syriza be elected with enough of a majority to organize a government, or will the more moderate parties gain power? According to Richard Barley of the Wall Street Journal, it will not matter. He stated in his Heard on the Street column that in the end there will simply be more talks between the Greeks, the International Monetary Fund (IMF), and the European Commission. The Greek banking system is being kept afloat by the ECB and that would not likely change. Support by the ECB will become much more complicated, however, if the Greeks do decide to renege on their previous austerity commitments. A more balanced outcome, in my opinion, will be a little of everything. The European powers will soften their stance slightly on Greece and the Greeks will continue to shrink their economy and try to live within their means. Will this be a long-term solution? I doubt it, but it could have the effect of stabilizing the markets for a while in the weeks to come.
The next question is what will the world political leaders do? The G-20 has a scheduled meeting beginning on Monday in Mexico and Greece will certainly be topic number one. German Chancellor Merkel is coming under ever-increasing pressure from the Europeans and the US to soften her objections to a broad European mechanism to provide direct funding to European sovereign governments. Ms. Merkel sees this step, which would include the issuance of Euro Bonds (much like our Treasuries) by the ECB, as a violation of the EU charter and putting German taxpayers at risk on behalf of their many spendthrift neighbors. I believe President Obama will be pushing hard for greater spending because he does not want a full-blown economic crisis in Europe just months ahead of his re-election. In the end, I believe, they will talk a lot, issue statements citing their concern over what is happening, and speak of their determination to take whatever steps are necessary to get the crisis under control. Then they will all fly home.
So what happens Monday? Hard to say exactly. There may be some short-term volatility as investors react to the news, but I believe everyone will quickly begin to look at the real end game and that is what is going to happen to Spain and Italy. Liquidity is always the first and most critical problem that must be addressed. Money is the oxygen of the economic body, and I believe the ECB will step in as necessary as they have done before and provide liquidity to the European banks. The markets will breathe a sigh of relief and we will go back to watching the political leadership attempt to resolve the real problems. Those problems include a region that is in recession if not approaching depression in the southern tier countries, unsustainable levels of unemployment, and no appetite for real economic reforms. These reforms will need to include a more fiscally united Europe with governments surrendering part of their sovereignty, labor/union reforms, pension reforms, and a reduction of governmental spending as a percentage of their own gross domestic products (GDPs). If it sounds difficult, it is. There is no certainty that the EU will be capable of undertaking all of this without having to withstand further shocks to their economic systems. No one wins if the entire EU unravels into chaos, so expect the ECB and others step in to mitigate any crisis that emerges.
(Note: The Greek's appear to have provided a parliamentary majority to the two parties favoring the Euro and Greece remaining in the EU. The two parties (New Democrats and Pasok) have three days to form a coalition government to implement the election results or go back to the polls. The yield on Spanish 10-year sovereign debt has pushed back above 7% reflecting a lack of confidence in the Spanish government's ability to repay its debts, and signals, in my opinion, that investors are looking beyond Greece and at the overall stability of the EU.)
LOOKING AHEAD
Sunday night looms. Some kind of decision will come from Greece. The G-20 will meet, and if things get totally out of control, look for central bank intervention. The poor economic news here in the US has been overwhelmed by the events in Europe, but make no mistake about it, the data last week confirmed that the US is continuing to slow down. Fortunately, the US is not in the same terrible shape as Europe, but we have our challenges. The recent economic weakness has brought the discussion of additional quantitative easing front and center once again, and all eyes will be watching the the Fed Chairman when Mr. Bernanke delivers his quarterly press conference Wednesday afternoon. This press conference, in my opinion, can be a market mover either way. If he announces or suggests that another round of quantitative easing is warranted, the markets will react favorably. The opposite could happen as well. The weakness in the US jobs market and the declining rate of inflation has observers believing there is room for additional easing and was one of the reasons the US markets rallied last week.
As you know, I follow the technical data provided by Dorsey Wright & Associates (DWA) to help gauge my understanding of what is happening in the markets. My principal market indicator, the New York Stock Exchange Bullish Percent (NYSEBP), had its first positive week in 13 (going back to week of March 11-16). Additionally, several of my very short-term indicators have provided some positive indicators. However, the overall trend of the market is still negative and thus I remain cautious, but I have seen some signs of improvement. Additionally, both the DJIA and S&P 500 have moved from being oversold to about fair value.
Additional analysis about the current status of the markets provided by DWA show that US stocks clearly remain the favored investment of the five major asset categories. Bonds continue to hold the number two spot while Currencies, International stocks,and Commodities rank three, four, and five with International stocks and Commodities continuing to fall below cash on a relative strength basis. Within the US stock asset category, mid capitalization growth stocks are favored as are equal-weighted investments over capitalization-weighted indexes. Among the major economic sectors, relative strength analysis favors Consumer Discretionary, Information Technology, and Financials. Real Estate has fallen to fifth position behind Consumer Staples. One final note. The indicators I review in this paragraph are longer-term in nature. As I noted earlier, large capitalization stocks represented by the S&P 500 have slipped ahead of mid capitalization stocks on a short-term basis. I will continue to follow this trend very closely.
The NYCE US Dollar Index is a measure that calculates the value of the US dollar through a basket of six currencies, the Euro, the Japanese Yen, the British Pound, the Canadian Dollar, the Swedish Krona, and the Swiss franc. The Euro is the predominant currency making up about 57% of the basket.
Currencies and futures generallyare volatile and are not suitable for
all investors. Investment in foreign exchange related products is subject to many factors that contribute to or increase volatility, such as national debt levels and trade deficits, changes in domestic and foreign interest rates, and investors' expectations concerning interest rates, currency exchange rates and global or regional political, economic or financial events and situations.
Investments in commodities may have greater volatility than investments in traditional securities, particularly if the instruments involve leverage. The value of commodity-linked derivative instruments may be affected by changes in overall market movements, commodity index volatility, changes in interest rates, or factors affecting a particular industry or commodity, including international economic, political and regulatory developments.
Emerging market investments involve higher risks than investments from developed countries and also involve increased risks due to differences in accounting methods, foreign taxation, political instability, and currency fluctuation. The main risks of international investing are currency fluctuations, differences in accounting methods, foreign taxation, economic, political or financial instability, and lack of timely or reliable information or unfavorable political or legal developments.
The Dow Jones UBS Commodities Index is composed of futures contracts on physical commodities. This index aims to provide a broadly diversified representation of commodity markets as an asset class. The index represents 19 commodities which are weighted to account for economic significance and market liquidity. This index cannot be traded directly. The commodities industries can be significantly affected by commodity prices, world events, import controls, worldwide competition, government regulations, and economic conditions. Past performance is no guarantee of future results. These investments may not be suitable for all investors, and there is no guarantee that any investment will be able to sell for a profit in the future.
TIPS are U.S. government securities designed to protect investors and the future value of their fixed-income investments from the adverse effects of inflation. Using the Consumer Price Index (CPI) as a guide, the value of the bond's principal is adjusted upward to keep pace with inflation. Increase in real interest rates can cause the price of inflation-protected debt securities to decrease. Interest payments on inflation-protected debt securities can be unpredictable.
As always, if you have any specific questions on your portfolio or wish to talk to me, please do not hesitate to call.
Sincerely,
Paul Merritt, MBA, AIF ®, CRPC ®
Principal
NTrust Wealth Management
P.S. If you think this type of analysis would be of benefit to anyone you know, please share this communication with them.
Past performance is not indicative of future results and there is no assurance that any forecasts mentioned in this report will be obtained. Technical analysis is just one form of analysis. You may also want to consider quantitative and fundamental analysis before making any investment decisions.
Information in this update has been obtained from and is based upon sources that NTrust Wealth Management (NTWM) believes to be reliable, however NTWM does not guarantee its accuracy. All opinions and estimates constitute NTWM's judgment as of the date the update was created and are subject to change without notice. This update is for informational purposes only and is not intended as an offer or solicitation for the purchase or sale of a security. Any decision to purchase securities must take into account existing public information on such security or any registered prospectus.
The bullish percent indicator (BPI) is a market breath indicator. The indicator is calculated by taking the total number of issues in an index or industry that are generating point and figure buy signals and dividing it by the total number of stocks in that group. The basic rule for using the bullish percent index is that when the BPI is above 70%, the market is overbought, and conversely when the indicator is below 30%, the market is oversold. The most popular BPI is the NYSE Bullish Percent Index, which is the tool of choice for famed point and figure analyst, Thomas Dorsey.
All indices are unmanaged and are not available for direct investment by the public. Past performance is not indicative of future results. The S&P 500 is based on the average performance of the 500 industrial stocks monitored by Standard & Poors, this is a market capitalization weighted index, meaning the largest companies in the S&P 500 have a greater weighting than smaller companies. The S&P 500 Equal Weighted Index is determined by giving each of the 500 stocks in the index the same weighting in the index. The Dow Jones Industrial Average is based on the average performance of 30 large U.S. companies monitored by Dow Jones & Company. The Dow Jones Corporate Bond Index is comprised of 96 investment grade issues that are divided into the industrial, financial, and utility/telecom sectors. They are further divided by maturity with each of the sectors represented by 2, 5, 10 and 30-year maturities. The Morgan Stanley Capital International (MSCI) Europe, Australia and Far East (EAFE) Index is a broad-based index composed of non U.S. stocks traded on the major exchanges around the globe. The Russell 2000 Index is comprised of the 2000 smallest companies within the Russell 3000 Index, which is made up of the 3000 biggest companies in the US.
Corporate bonds contain elements of both interest rate risk and credit risk. Treasury bills are guaranteed by the U.S. government as to the timely payment of principal and interest, and if held to maturity, offer a fixed rate of return and fixed principal value. U.S. Treasury bills do not eliminate market risk. The purchase of bonds is subject to availability and market conditions. There is an inverse relationship between the price of bonds and the yield: when price goes up, yield goes down, and vice versa. Market risk is a consideration if sold or redeemed prior to maturity. Some bonds have call features that may affect income.
Securities and Advisory Services offered through Commonwealth Financial Network®,
Member FINRA/SIPC, a Registered Investment Adviser.
This Communication is strictly intended for individuals residing in the states : CA DC FL KS MD NC NE OH OK TN TX VA. No offers may be made or accepted from any resident outside these states due to various state and registration requirements regarding investment through Commonwealth Financial Network. Member FINRA/SIPC products and services. Securities and Advisory Services offered (www.finra.org / www.sipc.org) a Registered Investment Adviser. www.commonwealth.com/termsofuse.html
Tuesday, June 19, 2012
Tuesday, June 5, 2012

US markets were slammed by news Friday morning that the US economy failed to meet modest job creation expectations (+150,000) with only 69,000 jobs created in May. This news was coupled with downward revisions of previously reported job growth numbers in March and April, and that the overall unemployment rate ticked up from 8.1% to 8.2%. The first quarter Gross Domestic Product (GDP) was also revised downward, as expected, to an anemic 1.9%; and data from Europe and China has not been encouraging. A tough environment for stocks.
The Dow Jones Industrial Average (DJIA) fell 275 points (-2.2%) on Friday and closed the week down 2.7% to finish at 12,119. The S&P 500 fell 2.5% Friday and lost 3.0% for the week. The Russell 2000 and NASDAQ fell by similar numbers and closed down 3.8% and 3.2% for the week respectively. As bad as the weekly numbers were for the US indexes, it was not the worst weekly performance in 2012. That honor goes to the week ending May 18th. For the year, the DJIA is now in negative territory losing 0.8% and wiping out nice gains from early in the year. The S&P 500 is now up 1.6% for the year, the Russell 2000 is down 0.5%, and the NASDAQ is still holding onto a 5.5% gain in 2012.
Energy led all major economic sectors down last week losing nearly 5% as oil prices continue to fall sharply. Consumer Discretionary, Financials, and Industrials lost between 3% and 4% to be the next weakest group of sectors. The more defensive Utilities and Telecom sectors were the best performing sectors losing around 1%.

Europe continues to lead international markets down as the European Union (EU) comes under greater economic distress. According to Bloomberg.com, Spanish banks collectively lost €66 billion ($82 billion) in deposits further undermining the strength of the banking system there and increasing the urgency of a coordinated response by the EU and the European Central Bank (ECB) to shore up the banks. Unemployment in Spain jumped to 24.3% and the overall unemployment rate in the EU reached 11%. Industrial output is also falling across the EU to levels not seen in 3 years. The drop in employment and reduced economic activity is straining government treasuries adding to the severity of the debt crisis in that region. The MSCI (EAFE) index fell 2.8% last week closing out a terrible May in which the MSCI (EAFE) fell 12.1% and is now down 7.1% for the year.
The Euro fell another 1% against the US dollar closing Friday at $1.240. The Euro's weakness began in May losing 6.6% and is now down 4.5% against the US dollar in 2012. This is not surprising when the migration of cash from Greek and Spanish banks is taken into consideration. I believe a significant amount of that money is finding its way into US dollars and subsequently into US Treasuries. I also believe that the recent strength in the US dollar is due primarily to fear and because US Treasuries yield slightly more than German Bunds.
Commodities are in full retreat as investors fear a global slowdown and a stronger US dollar makes commodity purchases more expensive to international buyers. China reported last week that its manufacturing sector barely made gains last month causing investors to anticipate demand from this large, commodity-consuming, country to begin falling. This cannot be a major revelation because I think that with China's two largest trading partners (US and EU) struggling to get their economies going, demand for Chinese goods is likely to be reduced. WTI Oil fell $6.82 (-7.5%) per barrel last week to close at $83.90. WTI Oil fell a sharp 17.6% in May and is now down 15.1% for the year. Gold, in contrast, gained $62.30 (4.0%) last week as speculation about additional monetary easing by the US Federal Reserve surfaced following the poor jobs report Friday morning. The Dow Jones UBS Commodity Index, measuring a broad basket of commodities, fell 4.4% last week and is now down 9.9% for the year.

Bond markets returned to their winning ways after a slight hiccup last week with the Barclays Aggregate Bond Index posting a 0.9% gain. The real story is US Treasury interest rates. The US 10-year yield dropped sharply (prices increased) Friday breaking below 1.5% for the first time EVER to close at 1.454% The other Treasury yields also fell and investors clamored for the safety of US Treasuries. The German 10-year yield closed Friday at 1.172%. The rates in Spain and Italy remain nervously high at 6.53% and 5.74% respectively; however, they did stabilize somewhat last week. This move in interest rates has pushed long-duration bonds to the top of the list of best performing bond sectors while high yield, emerging market, and preferreds the weakest.
UNCERTAINTY IS IN CONTROL
By every measure, investors are abandoning stocks and looking for safety. People are afraid. Afraid Europe is going to implode, that the US is stuck in economic slow motion, that China is not going to ride in and save global growth, and there appear to be few prospects to change things.

I do believe Europe is an absolute mess. Governments over there have been living beyond their means, promising benefits to their citizens that will be impossible to deliver, and that leadership has failed to make meaningful changes that might result in economic growth even in the face of this collapse. Not that change would be easy. There are powerful groups that seek to preserve the status quo and that the economic conditions there will continue to spiral downwards as mounting debt begins to make lenders nervous. Nervous lenders in turn demand higher interest payments, which in turn puts more pressure on governments to cut spending to reduce debt, which slows economies further making it more difficult to meet interest payments, causing investors to seek even higher interest payments to compensate them for this additional risk. In this scenario private lenders will leave the bond market and will have to be replaced by the ECB. The question is will the ECB be willing or able to bailout Europe? Uncertainty.
US economic growth is not good. Spinning the news and hyperbole is in full force on both sides of the political aisle. It is an election year and every data point will be analyzed and dissected to look for any political gain to be exploited by either side. What is known is that unemployment remains above 8%, GDP growth is under 2%, federal debt is approaching $16 trillion, and there does not appear to be any solutions in sight-at least not until the November elections are concluded. Uncertainty.
Investors hate uncertainty. Or at least a lot of uncertainty. As an early mentor of mine said over a decade ago, "uncertainty provides opportunity-opportunity is lost with certainty." This means that now is the time to evaluate possible opportunities. You start by evaluating your current portfolio and look for individual investments that make you uncomfortable and making a decision to either hold on to them or sell. If you sell, you increase your cash exposure to step in and buy other investments that you may have thought were too expensive to buy before. I like buying things on sale. Also look at investments that have become very overbought. Today that is long-duration government bonds. Federal and municipal, and to a lesser degree corporates. Consider selling some of these rich investments to raise cash for future investments.
When will we know when the market has bottomed? That is hard to say precisely. Increased volatility is a sign. Investors who become fearful sell heavily. Investors who are repositioning their portfolios (as I described above) sell. This selling makes markets move downwards, sometimes sharply. However, when buyers step in, the New York Stock Exchange Bullish Percent (NYSEBP) will reverse course and help give insight about the bottoming process. Last week, the NYSEBP fell yet again to close at 45.06. This was the eleventh straight week of declines, and twelfth of the past thirteen. I will be watching this major indicator very closely. I will also be watching interest rates. If US Treasury rates begin to rise, I believe that will be a result of investors liquidating their positions to move their money elsewhere, most likely stocks.
Uncertainty is unpleasant, but do not let the opportunity pass without evaluating your current situation and taking prudent action for the future.
LOOKING AHEAD
I believe we are going to be subjected to more of the same next week. Europe will continue to drive most news stories. Efforts are underway by all parties to try and gain control of the situation. Do not underestimate the efforts of the ECB. They surprised most investors last December with the Long Term Refinancing Option (LTRO) which calmed very jittery markets, and they may be working on another liquidity option. There will be renewed speculation

about the US Federal Reserve implementing another round of quantitative easing. This early speculation helped push gold prices up sharply on Friday. The Wisconsin recall election will be held Tuesday and may be interpreted as an indicator of how the November elections could turn out--or at least the pundits would like to spin it that way depending on the outcome. Finally, I would remind everyone that the Supreme Court is anticipated to release their ruling on ObamaCare sometime this month and that decision may be a catalyst to the markets either up or down.
After a week full of critical economic reports, this week will be relatively quiet. The most significant event will be Fed Chairman Bernanke's appearance before the Joint Economic Committee in Congress discussing the economic outlook. This will come just after the weekly release of the Initial Jobless Claims report (consensus calls for a decline of 4000 claims from 383,000 to 379,000). The International Trade report will be released on Friday. Consensus calls for the trade deficit to shrink from $51.8 billion to $49.3 billion. This report will be watched very closely for signs of economic strength or weakness in exports. Import data, I believe, will be helped by the sharp fall in oil prices.
The major analysis provided by Dorsey Wright & Associates about the current status of the markets show that US stocks clearly remain the favored investment of the five major asset categories. Bonds have made a strong move in the number two spot creating separation from the other asset categories. Currencies, International stocks,and Commodities rank three, four, and five with International stocks and Commodities ranking below cash on a relative strength basis. Within the US stock asset category, mid capitalization growth stocks are favored as are equal-weighted investments over capitalization-weighted indexes. Among the major economic sectors, relative strength analysis favors Consumer Discretionary, Information Technology, and Real Estate.
The NYCE US Dollar Index is a measure that calculates the value of the US dollar through a basket of six currencies, the Euro, the Japanese Yen, the British Pound, the Canadian Dollar, the Swedish Krona, and the Swiss franc. The Euro is the predominant currency making up about 57% of the basket.
Currencies and futures generallyare volatile and are not suitable for
all investors. Investment in foreign exchange related products is subject to many factors that contribute to or increase volatility, such as national debt levels and trade deficits, changes in domestic and foreign interest rates, and investors' expectations concerning interest rates, currency exchange rates and global or regional political, economic or financial events and situations.
Investments in commodities may have greater volatility than investments in traditional securities, particularly if the instruments involve leverage. The value of commodity-linked derivative instruments may be affected by changes in overall market movements, commodity index volatility, changes in interest rates, or factors affecting a particular industry or commodity, including international economic, political and regulatory developments.
Emerging market investments involve higher risks than investments from developed countries and also involve increased risks due to differences in accounting methods, foreign taxation, political instability, and currency fluctuation. The main risks of international investing are currency fluctuations, differences in accounting methods, foreign taxation, economic, political or financial instability, and lack of timely or reliable information or unfavorable political or legal developments.
The Dow Jones UBS Commodities Index is composed of futures contracts on physical commodities. This index aims to provide a broadly diversified representation of commodity markets as an asset class. The index represents 19 commodities which are weighted to account for economic significance and market liquidity. This index cannot be traded directly. The commodities industries can be significantly affected by commodity prices, world events, import controls, worldwide competition, government regulations, and economic conditions. Past performance is no guarantee of future results. These investments may not be suitable for all investors, and there is no guarantee that any investment will be able to sell for a profit in the future.
TIPS are U.S. government securities designed to protect investors and the future value of their fixed-income investments from the adverse effects of inflation. Using the Consumer Price Index (CPI) as a guide, the value of the bond's principal is adjusted upward to keep pace with inflation. Increase in real interest rates can cause the price of inflation-protected debt securities to decrease. Interest payments on inflation-protected debt securities can be unpredictable.
As always, if you have any specific questions on your portfolio or wish to talk to me, please do not hesitate to call.
P.S. If you think this type of analysis would be of benefit to anyone you know, please share this communication with them.
Sincerely,

Paul Merritt, MBA, AIF ®, CRPC ®
Principal
NTrust Wealth Management
Past performance is not indicative of future results and there is no assurance that any forecasts mentioned in this report will be obtained. Technical analysis is just one form of analysis. You may also want to consider quantitative and fundamental analysis before making any investment decisions.
Information in this update has been obtained from and is based upon sources that NTrust Wealth Management (NTWM) believes to be reliable, however NTWM does not guarantee its accuracy. All opinions and estimates constitute NTWM's judgment as of the date the update was created and are subject to change without notice. This update is for informational purposes only and is not intended as an offer or solicitation for the purchase or sale of a security. Any decision to purchase securities must take into account existing public information on such security or any registered prospectus.
The bullish percent indicator (BPI) is a market breath indicator. The indicator is calculated by taking the total number of issues in an index or industry that are generating point and figure buy signals and dividing it by the total number of stocks in that group. The basic rule for using the bullish percent index is that when the BPI is above 70%, the market is overbought, and conversely when the indicator is below 30%, the market is oversold. The most popular BPI is the NYSE Bullish Percent Index, which is the tool of choice for famed point and figure analyst, Thomas Dorsey.
All indices are unmanaged and are not available for direct investment by the public. Past performance is not indicative of future results. The S&P 500 is based on the average performance of the 500 industrial stocks monitored by Standard & Poors, this is a market capitalization weighted index, meaning the largest companies in the S&P 500 have a greater weighting than smaller companies. The S&P 500 Equal Weighted Index is determined by giving each of the 500 stocks in the index the same weighting in the index. The Dow Jones Industrial Average is based on the average performance of 30 large U.S. companies monitored by Dow Jones & Company. The Dow Jones Corporate Bond Index is comprised of 96 investment grade issues that are divided into the industrial, financial, and utility/telecom sectors. They are further divided by maturity with each of the sectors represented by 2, 5, 10 and 30-year maturities. The Morgan Stanley Capital International (MSCI) Europe, Australia and Far East (EAFE) Index is a broad-based index composed of non U.S. stocks traded on the major exchanges around the globe. The Russell 2000 Index is comprised of the 2000 smallest companies within the Russell 3000 Index, which is made up of the 3000 biggest companies in the US.
Corporate bonds contain elements of both interest rate risk and credit risk. Treasury bills are guaranteed by the U.S. government as to the timely payment of principal and interest, and if held to maturity, offer a fixed rate of return and fixed principal value. U.S. Treasury bills do not eliminate market risk. The purchase of bonds is subject to availability and market conditions. There is an inverse relationship between the price of bonds and the yield: when price goes up, yield goes down, and vice versa. Market risk is a consideration if sold or redeemed prior to maturity. Some bonds have call features that may affect income.
Securities and Advisory Services offered through Commonwealth Financial Network®,
Member FINRA/SIPC, a Registered Investment Adviser.
Wednesday, May 30, 2012
Markets paused from the May decline last week and most domestic stock indices posted gains for the first time in four weeks. Worries over Greece and its possible withdrawal from the European Union (EU) and the Euro subsided briefly with Greek elections still more than a month away on June 17th. However, Spain continues to worry investors especially after the Spanish government's announcement last Friday that they were providing Spain's third-largest bank, Bankia, SA, with €19 billion ($23.8 billion) in capital to save that bank. Such a large injection of capital
has raised fears that Spain may have to make similar moves for other banks further stretching the Spanish government's balance sheet. In European trading on Memorial Day (May 28, 2012) the Spanish 10-year yield jumped to a multi-month high of 6.479%. Here in the United States, the major economic reports of the week generally came in line with consensus showing a very modest economic recovery underway-no good news but no terrible news either. Finally, a survey released over the past weekend shows the pro-bailout parties in Greece gaining strength in the polls boosting hopes that the Greeks are not supporting withdrawal from the EU and a return to the Drachma. This report helped firm the Euro that has fallen over the past four weeks.
For the week, the Dow Jones Industrial Average (DJIA) posted a gain of 86 points (0.69%) while the S&P 500 added 1.7%, the Russell 2000 was up 2.6%, and the NASDAQ jumped 2.1%. May, however has been a tough month with all the major indexes posting significant declines. The DJIA is down 5.7%, the S&P 500 is down 5.7%, the Russell 2000 is down 6.2%, and the NASDAQ is down 6.7%. For the year the DJIA is up 1.9%, the S&P 500 is up 4.8%, the Russell 2000 is up 3.4%, and the NASDAQ is up 8.9%.
All of the major economic sectors were positive last week led by Materials, Consumer Discretionary, Industrials, and Real Estate. Telecom, Utilities, and Consumer Staples were the weakest sectors for the week with only Telecom not outperforming the DJIA. Twenty-one weeks through 2012, Consumer Discretionary, Information Technology, and Real Estate are the top three performing major economic sectors while Energy, Utilities, and Telecom are the bottom three with Energy and Utilities negative for 2012.
As I have already noted, Europe is a complete mess. The EU is wracked by high unemployment, political uncertainty, and slowing economic output. The debate between austerity and Keynesian spending to stimulate growth rages on with no clear winner. Not surprisingly, the equity markets reflect these conditions. The MSCI (EAFE) index fell another 0.5% last week and is now down 10.9% for the month, and down 4.4% for the year. After a strong start, the Emerging Market sector has given back all of its gains for the year with a loss of 12.4% in May leaving this volatile sector down 2.1% for the year. The best performing region globally has been the Americas region that has lost 6.6% for the month, but remains positive by 3.6% for the year.
The Euro and other major foreign currencies continue to fall against the US dollar as investors seek safety in the US currency. The Euro closed Friday at $1.252 down over seven cents from the start of the month, and is now down 4.2 cents for the year. The US dollar is the go-to currency as worries increase abroad, so look no further than the US Dollar Index to gage fears in global markets. The US Dollar Index has gained 4.8% in May and is up 2.8% in 2012.
Commodities continue to struggle under the weight of a strengthening US dollar and a weakening global economy. The broad basket Dow Jones UBS Commodity Index fell 2.5% last week and is now down 5.8% for the year. China, which has been having a poor year by Chinese standards, has not been in the headlines ahead of Greece and Spain, but a drop in demand by the Chinese has certainly influenced global commodity prices. For the week, gold fell just over 2% to close at $1559.80 and is down 6.4% for the month, and 0.4% for the year. Oil has really pulled back losing 0.8% last week to close at $90.72. For the month, oil has fallen 13.4%, and is now down 8.2% for the year. Oil has held at the $90/barrel price, and I believe this remains an important support level.
Bond markets broke a 9-week positive run as the Barclays Aggregate Bond Index posted a drop of 0.2%. It is too early to read too much into this trend break, but it bears watching. US Treasury yields rose (prices down) with the 10-year and 30-year rates closing Friday at 1.738% and 2.842% respectively. These rates remain very low and reflect the fear most investors currently have. All but Spanish yields fell last week with the German 10-year Bund closing Friday at 1.37%. Interest rates continue to be a barometer of investor's fear levels, and the heavy hand of central banks makes it a difficult asset category to figure out. For the week, preferreds and high yield municipals were the best performing bond sectors while extended duration government and corporate bonds the weakest. For the year, preferreds and municipal high yield are the best performing bond sectors with high yield and short duration (domestic and international) the worst.
THE MARKETS ARE WASHED OUT
The media translates oversold markets into interesting headlines. For example, the Financial Times included the headline last Thursday questioning whether stocks will continue as a viable investment in the future. Wow. That is an amazing concept. The past decade's poor performance and volatility of stocks has certainly frustrated investors and may well continue to do so for the foreseeable future, however, this does not mean stocks are done being a good investment. It is also not the first time the media has taken us down this road. Look at the BusinessWeek cover from
August 13, 1979. Did this headline mark the bottom of the market? No, but it did come just a few short years ahead of one of the greatest bull markets in history.
I believe we are all influenced more by recent events rather than past historical occurrences. I remember clearly how the Great Depression affected my grandparents and their subsequent behavior in the years following those difficult times. Yet to most of us, the Depression is just another chapter in a history text. Today, however, we are all keenly aware of first the dot.com implosion in the markets early in the 2000's, and then the Great Recession in 2008 when markets dropped to levels not seen in decades. So it is perfectly natural for most of us to fear the uncertainly found in today's markets, but that fear should not prevent you from making smart investment decisions. Let us look at where we are today.
I have discussed the concept of overbought or oversold markets before, but let me quickly review. The price of an investment (or an index) is tracked on a daily basis and the most recent 10-week price history is plotted by Dorsey Wright & Associates (DWA) on a statistical bell curve. Three standard deviations, by definition, account for 99.7% of all prices above and below the mean during the 10-week period. If the investment price falls to the far left of the bell curve (three standard deviations) it is considered 100% oversold, however, if the price continues to fall (moves further left on the curve) it can reach even higher oversold percentages. The converse is true for rising prices. The DJIA and S&P 500 indexes are currently oversold by about 63%...high, but not extreme.
When looking at historical patterns, DWA has drawn several conclusions. First, prices do not remain oversold forever and typically rebound at some point. Second, when prices become oversold, especially by a wide margin, it can be a positive signal to come back into the market. Looking at major market segments the following conclusions can be taken from the current DWA data: bonds are somewhat overbought while international equity investments, especially Emerging Markets, are at very oversold levels; and US equities are moderately oversold. Remember too that summer is historically a weak time of year, and the New York Stock Exchange Bullish Percent remains in a defensive posture falling for a tenth consecutive week to close Friday at 48.52. All this information together continues to signal caution, but risk levels are falling.
LOOKING AHEAD
As much as all of us are tired of hearing news about Europe, I am sorry to say that I expect Europe to continue to dominate the news in the coming week. While the future of Greece will garner the majority of headlines, I believe the most important story will be what happens to Spain and the recapitalization of its banks. Spain is a much, much larger economy than Greece, and the Europeans will be hard pressed to bailout Spain should it come down to that.
Interest rates will continue to be an important indicator of investor sentiment. Higher rates in Spain, I believe, will signal growing risk in that country's finances, while falling interest rates elsewhere will signal a gloomy outlook by investors. Historically low interest rates mean that investors are afraid and lack confidence in the longer-term outlook of the economy. The Euro and the US Dollar Index also will continue to signal the appetite for risk in the markets. A rising Euro and falling US Dollar Index will be signalling risk is back, while the converse is true.
Thursday and Friday of this week will offer a host of critical economic reports. Thursday will have the ususal Initial Jobless Claims report (no change expected from last week), but also the first revision of the Gross Domestic Product (GDP) for the first quarter of 2012. Consensus calls for a revision downward from 2.1% to 1.9%. Friday's reports include the Employment Situation for May and new jobs are expected to grow by 150,000 compared to last month's increase of just 115,000. The unemployment rate is expected to remain steady at 8.1%. Personal income is expected to remain steady, while the ISM Manufacturing Index is expected to contract very slightly. All are key reports and any significant departure from the consensus may well move markets either up or down.
The major analysis provided by DWA about the current status of the markets show that US stocks clearly remain the favored investment of the five major asset categories. There has been constant reshuffling of the four remaining asset categories. As of Friday, Bonds and Currencies occupy the second and third positions followed by Commodities and International stocks. Commodities and International stocks are very weak at the current time and I am avoiding for now. Within the US stock asset category, mid capitalization growth stocks are favored as are equal-weighted investments over capitalization-weighted indexes. Among the major economic sectors, relative strength analysis favors Consumer Discretionary, Information Technology, and Real Estate.
The NYCE US Dollar Index is a measure that calculates the value of the US dollar through a basket of six currencies, the Euro, the Japanese Yen, the British Pound, the Canadian Dollar, the Swedish Krona, and the Swiss franc. The Euro is the predominant currency making up about 57% of the basket.
Currencies and futures generallyare volatile and are not suitable for
all investors. Investment in foreign exchange related products is subject to many factors that contribute to or increase volatility, such as national debt levels and trade deficits, changes in domestic and foreign interest rates, and investors' expectations concerning interest rates, currency exchange rates and global or regional political, economic or financial events and situations.
Investments in commodities may have greater volatility than investments in traditional securities, particularly if the instruments involve leverage. The value of commodity-linked derivative instruments may be affected by changes in overall market movements, commodity index volatility, changes in interest rates, or factors affecting a particular industry or commodity, including international economic, political and regulatory developments.
Emerging market investments involve higher risks than investments from developed countries and also involve increased risks due to differences in accounting methods, foreign taxation, political instability, and currency fluctuation. The main risks of international investing are currency fluctuations, differences in accounting methods, foreign taxation, economic, political or financial instability, and lack of timely or reliable information or unfavorable political or legal developments.
The Dow Jones UBS Commodities Index is composed of futures contracts on physical commodities. This index aims to provide a broadly diversified representation of commodity markets as an asset class. The index represents 19 commodities which are weighted to account for economic significance and market liquidity. This index cannot be traded directly. The commodities industries can be significantly affected by commodity prices, world events, import controls, worldwide competition, government regulations, and economic conditions. Past performance is no guarantee of future results. These investments may not be suitable for all investors, and there is no guarantee that any investment will be able to sell for a profit in the future.
TIPS are U.S. government securities designed to protect investors and the future value of their fixed-income investments from the adverse effects of inflation. Using the Consumer Price Index (CPI) as a guide, the value of the bond's principal is adjusted upward to keep pace with inflation. Increase in real interest rates can cause the price of inflation-protected debt securities to decrease. Interest payments on inflation-protected debt securities can be unpredictable.
As always, if you have any specific questions on your portfolio or wish to talk to me, please do not hesitate to call.
P.S. If you think this type of analysis would be of benefit to anyone you know, please share this communication with them.
Sincerely,
Paul Merritt, MBA, AIF ®, CRPC ®
Principal
NTrust Wealth Management
Past performance is not indicative of future results and there is no assurance that any forecasts mentioned in this report will be obtained. Technical analysis is just one form of analysis. You may also want to consider quantitative and fundamental analysis before making any investment decisions.
Information in this update has been obtained from and is based upon sources that NTrust Wealth Management (NTWM) believes to be reliable, however NTWM does not guarantee its accuracy. All opinions and estimates constitute NTWM's judgment as of the date the update was created and are subject to change without notice. This update is for informational purposes only and is not intended as an offer or solicitation for the purchase or sale of a security. Any decision to purchase securities must take into account existing public information on such security or any registered prospectus.
The bullish percent indicator (BPI) is a market breath indicator. The indicator is calculated by taking the total number of issues in an index or industry that are generating point and figure buy signals and dividing it by the total number of stocks in that group. The basic rule for using the bullish percent index is that when the BPI is above 70%, the market is overbought, and conversely when the indicator is below 30%, the market is oversold. The most popular BPI is the NYSE Bullish Percent Index, which is the tool of choice for famed point and figure analyst, Thomas Dorsey.
All indices are unmanaged and are not available for direct investment by the public. Past performance is not indicative of future results. The S&P 500 is based on the average performance of the 500 industrial stocks monitored by Standard & Poors, this is a market capitalization weighted index, meaning the largest companies in the S&P 500 have a greater weighting than smaller companies. The S&P 500 Equal Weighted Index is determined by giving each of the 500 stocks in the index the same weighting in the index. The Dow Jones Industrial Average is based on the average performance of 30 large U.S. companies monitored by Dow Jones & Company. The Dow Jones Corporate Bond Index is comprised of 96 investment grade issues that are divided into the industrial, financial, and utility/telecom sectors. They are further divided by maturity with each of the sectors represented by 2, 5, 10 and 30-year maturities. The Morgan Stanley Capital International (MSCI) Europe, Australia and Far East (EAFE) Index is a broad-based index composed of non U.S. stocks traded on the major exchanges around the globe. The Russell 2000 Index is comprised of the 2000 smallest companies within the Russell 3000 Index, which is made up of the 3000 biggest companies in the US.
Corporate bonds contain elements of both interest rate risk and credit risk. Treasury bills are guaranteed by the U.S. government as to the timely payment of principal and interest, and if held to maturity, offer a fixed rate of return and fixed principal value. U.S. Treasury bills do not eliminate market risk. The purchase of bonds is subject to availability and market conditions. There is an inverse relationship between the price of bonds and the yield: when price goes up, yield goes down, and vice versa. Market risk is a consideration if sold or redeemed prior to maturity. Some bonds have call features that may affect income.
Securities and Advisory Services offered through Commonwealth Financial Network®,
Member FINRA/SIPC, a Registered Investment Adviser.
Thursday, May 24, 2012
This week's Market Update will be abbreviated due to my travel over the past weekend.
Selling across all markets accelerated this past week as the world watches the Greek government implode. This little, and historically poorly run country in financial terms, has caused markets to react negatively to the news of a possible exit from the Euro currency and European Union. The nervousness by investors has more to do with two key points: first, if Greece can go-who is next? Second, once the spendthrift Greeks are dispatched, who will be next? Spain and Italy are top candidates. These countries have large economies and many pundits do not believe that the EU has the assets for a bailout of these two weak economies.
The other drama that is playing out in Europe and here in the United States concerns the strength of German Chancellor Angela Merkel's commitment to austerity in the EU. Ms. Merkel is coming under increasing pressure from all sides, including President Obama, to loosen up the constraints on the European Central Bank (ECB) and get money flowing directly from the ECB to the sovereign governments within the EU (through the creation of Euro Bonds). The only problem, and one that the German's keep reminding everyone about, is that the treaty forming the EU does not permit direct payments to sovereign governments. So as Greece remains in chaos and many of the Europeans begin to tire of austerity cuts, and the Germans continue to ask other EU countries to undertake meaningful fiscal reforms, the rest of us are left wondering how much collateral damage will be extracted on the rest of the world. Unfortunately, there does not seem to be any consensus on this key issue so we will have to continue to observe events as they unfold and the market's reactions to those events.
"You can observe a lot by watching," is one of my favorite Yogi Berra quotes. For those of you who are not baseball fans, Yogi was a catcher for the New York Yankees from 1946 until 1963 and is one of the most beloved and successful ball players in baseball history. As an aside, Yogi began his professional baseball career playing here in Hampton Roads for the Norfolk Tars in 1942. Yogi's quote is very profound and one that I believe in regarding financial markets. I am watching interest rates, the strength of the US dollar, the New York Stock Exchange Bullish Percent (NYSEBP), and the Dorsey Wright Dynamic Asset Level Investing (D.A.L.I.)® indicators.
Interest rates have fallen sharply over the past month or so. The US Treasury 10-year yield closed Friday at 1.714%. The most recent inflation data from the Bureau of Labor Statistics showed the current annualized rate at 2.30% meaning that investors are receiving a negative 0.589% real return on their investment. That is a very risk adverse trade and indicates that parking money with a nominal return is more important to investors than making money. The US dollar has risen steadily since the start of the month. I believe that a rising US dollar is a risk adverse trade and global investors are buying US dollars for safety. This means that US exports become more expensive, commodities become more expensive, and returns of foreign stocks are impaired by the currency conversion. The NYSEBP continues to fall meaning that fewer stocks have positive momentum for now. I will be looking for that to change. Finally, the five major asset categories that I track using D.A.L.I. have been jumping around with the exception of US stocks. The US equities category has been the consistent leader among the asset classes and is now followed by Bonds, Foreign Currencies, Commodities, and International stocks have fallen to last place.
Times are challenging and the markets reflect this reality. I am watching Europe closely and looking for any significant movement of the key indicators discussed above.
If you have any specific questions, please give me a call. I wish everyone a very Happy Memorial Day and please take a moment to remember the sacrifices made by our men and women in uniform who have made this country great. Our freedom and security are their legacy.
The NYCE US Dollar Index is a measure that calculates the value of the US dollar through a basket of six currencies, the Euro, the Japanese Yen, the British Pound, the Canadian Dollar, the Swedish Krona, and the Swiss franc. The Euro is the predominant currency making up about 57% of the basket.
Currencies and futures generallyare volatile and are not suitable for
all investors. Investment in foreign exchange related products is subject to many factors that contribute to or increase volatility, such as national debt levels and trade deficits, changes in domestic and foreign interest rates, and investors' expectations concerning interest rates, currency exchange rates and global or regional political, economic or financial events and situations.
Investments in commodities may have greater volatility than investments in traditional securities, particularly if the instruments involve leverage. The value of commodity-linked derivative instruments may be affected by changes in overall market movements, commodity index volatility, changes in interest rates, or factors affecting a particular industry or commodity, including international economic, political and regulatory developments.
Emerging market investments involve higher risks than investments from developed countries and also involve increased risks due to differences in accounting methods, foreign taxation, political instability, and currency fluctuation. The main risks of international investing are currency fluctuations, differences in accounting methods, foreign taxation, economic, political or financial instability, and lack of timely or reliable information or unfavorable political or legal developments.
The Dow Jones UBS Commodities Index is composed of futures contracts on physical commodities. This index aims to provide a broadly diversified representation of commodity markets as an asset class. The index represents 19 commodities which are weighted to account for economic significance and market liquidity. This index cannot be traded directly. The commodities industries can be significantly affected by commodity prices, world events, import controls, worldwide competition, government regulations, and economic conditions. Past performance is no guarantee of future results. These investments may not be suitable for all investors, and there is no guarantee that any investment will be able to sell for a profit in the future.
TIPS are U.S. government securities designed to protect investors and the future value of their fixed-income investments from the adverse effects of inflation. Using the Consumer Price Index (CPI) as a guide, the value of the bond's principal is adjusted upward to keep pace with inflation. Increase in real interest rates can cause the price of inflation-protected debt securities to decrease. Interest payments on inflation-protected debt securities can be unpredictable.
As always, if you have any specific questions on your portfolio or wish to talk to me, please do not hesitate to call.
P.S. If you think this type of analysis would be of benefit to anyone you know, please share this communication with them.
Sincerely,
Paul Merritt, MBA, AIF ®, CRPC ®
Principal
NTrust Wealth Management
Past performance is not indicative of future results and there is no assurance that any forecasts mentioned in this report will be obtained. Technical analysis is just one form of analysis. You may also want to consider quantitative and fundamental analysis before making any investment decisions.
Information in this update has been obtained from and is based upon sources that NTrust Wealth Management (NTWM) believes to be reliable, however NTWM does not guarantee its accuracy. All opinions and estimates constitute NTWM's judgment as of the date the update was created and are subject to change without notice. This update is for informational purposes only and is not intended as an offer or solicitation for the purchase or sale of a security. Any decision to purchase securities must take into account existing public information on such security or any registered prospectus.
The bullish percent indicator (BPI) is a market breath indicator. The indicator is calculated by taking the total number of issues in an index or industry that are generating point and figure buy signals and dividing it by the total number of stocks in that group. The basic rule for using the bullish percent index is that when the BPI is above 70%, the market is overbought, and conversely when the indicator is below 30%, the market is oversold. The most popular BPI is the NYSE Bullish Percent Index, which is the tool of choice for famed point and figure analyst, Thomas Dorsey.
All indices are unmanaged and are not available for direct investment by the public. Past performance is not indicative of future results. The S&P 500 is based on the average performance of the 500 industrial stocks monitored by Standard & Poors, this is a market capitalization weighted index, meaning the largest companies in the S&P 500 have a greater weighting than smaller companies. The S&P 500 Equal Weighted Index is determined by giving each of the 500 stocks in the index the same weighting in the index. The Dow Jones Industrial Average is based on the average performance of 30 large U.S. companies monitored by Dow Jones & Company. The Dow Jones Corporate Bond Index is comprised of 96 investment grade issues that are divided into the industrial, financial, and utility/telecom sectors. They are further divided by maturity with each of the sectors represented by 2, 5, 10 and 30-year maturities. The Morgan Stanley Capital International (MSCI) Europe, Australia and Far East (EAFE) Index is a broad-based index composed of non U.S. stocks traded on the major exchanges around the globe. The Russell 2000 Index is comprised of the 2000 smallest companies within the Russell 3000 Index, which is made up of the 3000 biggest companies in the US.
Corporate bonds contain elements of both interest rate risk and credit risk. Treasury bills are guaranteed by the U.S. government as to the timely payment of principal and interest, and if held to maturity, offer a fixed rate of return and fixed principal value. U.S. Treasury bills do not eliminate market risk. The purchase of bonds is subject to availability and market conditions. There is an inverse relationship between the price of bonds and the yield: when price goes up, yield goes down, and vice versa. Market risk is a consideration if sold or redeemed prior to maturity. Some bonds have call features that may affect income.
Securities and Advisory Services offered through Commonwealth Financial Network®,
Member FINRA/SIPC, a Registered Investment Adviser.
Monday, May 14, 2012
Equity markets continued to retreat last week as fears grew over Greece's political instability and its possible impact on the European Union, and news that banking stalwart, JP Morgan, has suffered some $2 billion in trading losses with the potential for another $1 billion. Less apparent was Cisco Systems' bad week after announcing relatively low growth projections for the remainder of 2012. The "risk off" trade is in control for now.
The Dow Jones Industrial Average (DJIA) posted its second consecutive worst weekly performance in 2012 losing 1.7% following the previous week's loss of 1.4%. DJIA components Cisco Systems and JP Morgan suffered losses of 13.7% and 11.5% respectively and contributed to much of the DJIA's drop, but they were not alone with 20 of the other 30 companies that comprise the index losing value last week as well. For the year, the DJIA is now up 4.9%. The S&P 500 faired a little better losing 1.2% for the week, while the broader Russell 2000 index posted a loss of just 0.2% and the NASDAQ lost 0.8%. After 19 weeks of trading in 2012 the S&P 500 is up 7.6%, the Russell 2000 is up by 6.6%, and the NASDAQ continues to lead posting a gain of 12.6%.
The European Union (EU) remains under considerable stress as the Greeks appear unable to cobble a coalition together to form a government. Investors worry that the new Greek government will be unable to or unwilling to adhere to austerity measures agreed to with the EU in order to qualify for bailout funds increasing the possibility that Greece may have to exit the EU. France appears, for now, to be transitioning smoothly to a new socialist government; however, Spain is back in the news after the rapid and unexpected nationalization of that country's fourth largest bank. Across the globe, China's economy appears to be slowing and doubts are growing that the Chinese can lift the world economy. For the week, the MSCI EAFE index lost 2.65% with the Asian/Pacific region posting a sharp 4.3% drop. For the year, the MSCI EAFE is now up 2.3% and the Americas region leads all others posting a 7% gain. The Emerging Markets region is up 5.5% as is the Developed Markets region, while the Asia/Pacific region is up 4.4%.
The Euro continued to fall as investors sold Euros and sought safety in the US dollar. The Euro fell nearly two cents (-1.3%) to close Friday at $1.291. The US Dollar Index gained another 1% and is now up 0.15% for the year. Whenever the US dollar has risen over the past year or so, it has generally been accompanied by a falling stock market, falling commodity prices, and falling US interest rates.
Commodities fell again last week over continued worries about the strength of the global recovery and fears of a major setback in the EU pushed the dollar stronger which in turn helps push commodity prices down. The Dow Jones UBS Commodity Index constructed with a broad basket of commodities fell 1.7% following last week's 2.7% drop and the index is now down 4.2% for the year. Gold prices dropped 3.7% and WIT Oil prices fell nearly 3%. Gold's pullback was due in part to the better than expected decline in the Producer Price Index released last Friday helped mostly by falling oil prices. The only bright spots in commodities last week were natural gas, coffee, and cocoa which where were all up around 1%. Metals and agriculture were the weakest commodity sectors for the week.
Bond markets gained for the eighth consecutive week with the Barclays Aggregate Bond Index up a very modest 0.09%. US Treasury yields fell (prices up) last week. The 10-year Treasury interest rate closed Friday at 1.845% to the previous Friday close of 1.876%. The 30-year closed Friday at 3.011% compared to the previous Friday close of 3.071%. Spanish 10-year interest rates pushed over the dangerous 6% level on Friday closing at 6.007%. This is clearly a warning sign that things are not good in Spain today. The French 10-year fell slightly to close Friday at 2.804% suggesting that the credit markets are still waiting to see what newly elected French president, Francois Hollande will actually do. For the week, extended duration US Treasuries and corporate bonds were the best performing bond sector. The worst performing sectors were Emerging market debt and International bonds.
TIME TO SELL?
Two weeks ago the markets looked great. The DJIA had reached a recent multi-year high of 13,360 during the day on May 1st but since then the Dow has fallen 4.0%. Not great, but not terrible or unusual either. In fact, markets do this on a regular basis. The S&P 500 has, on average, had three to four 5%+ corrections every year since 1928 (Source: Ned Davis Research/Wells Fargo). What we have seen most recently is known as a buying climax. A buying climax occurs when a stock (or in this case an index) makes a new yearly high, often early in the week (May 1st was a Tuesday) but then declines and closes down for the week as a whole (-1.44%). A "climax" does not mean that a stock or market (index) has finished a long-term move, or that a change in trend is on the horizon, it is simply an indication that a near-term top has been reached. Sometimes such a near-term top turns into something of long-term relevance, but just as often this is not the case and so we should look no further than our headlights (data) can illuminate.
I follow a series of data provided by Dorsey Wright & Associates (DWA). One of the data points I evaluate is where a stock or index is sitting compared to its ten-week trading band. A trading band is simply a statistical bell curve placed over a stock or index's past ten weeks of price history. If a stock or index is trading in the middle of the trading band it is considered to be fairly priced (the ten-week mean). A stock or index can be considered overbought if it is trading well above the middle of the band, and oversold if it is trading toward the bottom of the ten-week band. For those of you who have a background in statistics, the top and bottom of the bands are three standard deviations each. The bands are recalculated weekly. Today the DJIA is trading just below the middle of its ten-week band. In simple English, the market is just slightly oversold at this time. The S&P 500 is also oversold by about the same amount. This is not the time to panic and sell; however, this is not the time to be complacent either. Review individual positions and watch each closely.
I am not trying to sound pollyannaish about the last two weeks, I see what you see. However, I also see the markets within the context of years of market behavior. There is a lot of risk and uncertainty out there and I am not diminishing those risks. I have not liked international stocks for some time, and US stocks continue to have a very wide lead on all the other four major asset categories evaluated by DWA (Commodities, Bonds, International, and Currencies). Commodities have come under stress as global economic growth weakens and the US dollar strengthens, while Bonds have been a very steady investment so far in 2012. Currencies have done little and the US dollar is consolidating with the Euro.
So I believe that now is not the to time sell stocks, but do keep an eye on the markets to see how they continues to shape up.
LOOKING AHEAD
The Europeans are still fighting the political and economic turmoil that has embraced that part of the world. The Greeks will attempt to form a government, but what form that government takes is completely unknown. Indications are that this new government will not be onboard with the German view of the EU. France is also expected to push back against the Germans. The Spanish government and banks will continue to face very tough choices and the Spaniards may have to continue bailing out their banks. The question that Spain must answer is, "where will the government get the money?" I believe that markets will continue to react to any news or economic data that validate any global growth or contraction.
Following a week with little economic data, there are a fairly large number of important reports due out this week. Tuesday kicks off with April Retail Sales and the April Consumer Price Index (CPI). The consensus for retail sales is to pull back from a gain in March of 0.8% to just 0.1% in April. The CPI is expected to be flat after a 0.3% increase in March. Declining energy prices are a major contributor to this consensus number. April Housing Starts and Industrial Production will be released Wednesday along with the Federal Open Market Committee (FOMC) minutes. Housing starts are expected to rise slightly from March and economists are anticipating a moderate jump in industrial production after a flat March. The FOMC minutes will be scrutinized for any indication that the Federal Reserve is considering another round of quantitative easing. Finally, Thursday brings the Initial Jobless Claims report. Consensus calls for a reduction of 2000 first time claims to a level of 365,000.
Even with the moderate sell-off over the past couple of weeks, my views about the markets developed through the DWA relative strength analysis are only slightly changed. US stocks remains the strongest asset category followed by Commodities, Bonds, International stocks, and Currencies. US stocks retain a very sizable lead over the other categories. Commodities have shown considerable weakness, and I am not adding to positions and will look to trim if oil and gold prices continue to pull back. Mid-capitalization stocks are favored, growth is favored over value, and equal-weighted indexes are favored over capitalization-weighted ones. On a relative strength basis, DWA puts Consumer Discretionary, Information Technology, and Financials as the three strongest economic sectors. The New York Stock Exchange Bullish Percent (NYSEBP) fell again last week and remains in an eight week negative trend. The current reading of 59.64 is now just over seven points above the 52.96 level at the start of 2012. Markets remain in a weakening trend with uncertainty abroad increasing.
The NYCE US Dollar Index is a measure that calculates the value of the US dollar through a basket of six currencies, the Euro, the Japanese Yen, the British Pound, the Canadian Dollar, the Swedish Krona, and the Swiss franc. The Euro is the predominant currency making up about 57% of the basket.
Currencies and futures generallyare volatile and are not suitable for
all investors. Investment in foreign exchange related products is subject to many factors that contribute to or increase volatility, such as national debt levels and trade deficits, changes in domestic and foreign interest rates, and investors' expectations concerning interest rates, currency exchange rates and global or regional political, economic or financial events and situations.
Investments in commodities may have greater volatility than investments in traditional securities, particularly if the instruments involve leverage. The value of commodity-linked derivative instruments may be affected by changes in overall market movements, commodity index volatility, changes in interest rates, or factors affecting a particular industry or commodity, including international economic, political and regulatory developments.
Emerging market investments involve higher risks than investments from developed countries and also involve increased risks due to differences in accounting methods, foreign taxation, political instability, and currency fluctuation. The main risks of international investing are currency fluctuations, differences in accounting methods, foreign taxation, economic, political or financial instability, and lack of timely or reliable information or unfavorable political or legal developments.
The Dow Jones UBS Commodities Index is composed of futures contracts on physical commodities. This index aims to provide a broadly diversified representation of commodity markets as an asset class. The index represents 19 commodities which are weighted to account for economic significance and market liquidity. This index cannot be traded directly. The commodities industries can be significantly affected by commodity prices, world events, import controls, worldwide competition, government regulations, and economic conditions. Past performance is no guarantee of future results. These investments may not be suitable for all investors, and there is no guarantee that any investment will be able to sell for a profit in the future.
TIPS are U.S. government securities designed to protect investors and the future value of their fixed-income investments from the adverse effects of inflation. Using the Consumer Price Index (CPI) as a guide, the value of the bond's principal is adjusted upward to keep pace with inflation. Increase in real interest rates can cause the price of inflation-protected debt securities to decrease. Interest payments on inflation-protected debt securities can be unpredictable.
As always, if you have any specific questions on your portfolio or wish to talk to me, please do not hesitate to call.
P.S. If you think this type of analysis would be of benefit to anyone you know, please share this communication with them.
Sincerely,
Paul Merritt, MBA, AIF ®, CRPC ®
Principal
NTrust Wealth Management
Past performance is not indicative of future results and there is no assurance that any forecasts mentioned in this report will be obtained. Technical analysis is just one form of analysis. You may also want to consider quantitative and fundamental analysis before making any investment decisions.
Information in this update has been obtained from and is based upon sources that NTrust Wealth Management (NTWM) believes to be reliable, however NTWM does not guarantee its accuracy. All opinions and estimates constitute NTWM's judgment as of the date the update was created and are subject to change without notice. This update is for informational purposes only and is not intended as an offer or solicitation for the purchase or sale of a security. Any decision to purchase securities must take into account existing public information on such security or any registered prospectus.
The bullish percent indicator (BPI) is a market breath indicator. The indicator is calculated by taking the total number of issues in an index or industry that are generating point and figure buy signals and dividing it by the total number of stocks in that group. The basic rule for using the bullish percent index is that when the BPI is above 70%, the market is overbought, and conversely when the indicator is below 30%, the market is oversold. The most popular BPI is the NYSE Bullish Percent Index, which is the tool of choice for famed point and figure analyst, Thomas Dorsey.
All indices are unmanaged and are not available for direct investment by the public. Past performance is not indicative of future results. The S&P 500 is based on the average performance of the 500 industrial stocks monitored by Standard & Poors, this is a market capitalization weighted index, meaning the largest companies in the S&P 500 have a greater weighting than smaller companies. The S&P 500 Equal Weighted Index is determined by giving each of the 500 stocks in the index the same weighting in the index. The Dow Jones Industrial Average is based on the average performance of 30 large U.S. companies monitored by Dow Jones & Company. The Dow Jones Corporate Bond Index is comprised of 96 investment grade issues that are divided into the industrial, financial, and utility/telecom sectors. They are further divided by maturity with each of the sectors represented by 2, 5, 10 and 30-year maturities. The Morgan Stanley Capital International (MSCI) Europe, Australia and Far East (EAFE) Index is a broad-based index composed of non U.S. stocks traded on the major exchanges around the globe. The Russell 2000 Index is comprised of the 2000 smallest companies within the Russell 3000 Index, which is made up of the 3000 biggest companies in the US.
Corporate bonds contain elements of both interest rate risk and credit risk. Treasury bills are guaranteed by the U.S. government as to the timely payment of principal and interest, and if held to maturity, offer a fixed rate of return and fixed principal value. U.S. Treasury bills do not eliminate market risk. The purchase of bonds is subject to availability and market conditions. There is an inverse relationship between the price of bonds and the yield: when price goes up, yield goes down, and vice versa. Market risk is a consideration if sold or redeemed prior to maturity. Some bonds have call features that may affect income.
Securities and Advisory Services offered through Commonwealth Financial Network®,
Member FINRA/SIPC, a Registered Investment Adviser.
Subscribe to:
Posts (Atom)