US markets were slammed by news Friday morning that the US economy failed to meet modest job creation expectations (+150,000) with only 69,000 jobs created in May. This news was coupled with downward revisions of previously reported job growth numbers in March and April, and that the overall unemployment rate ticked up from 8.1% to 8.2%. The first quarter Gross Domestic Product (GDP) was also revised downward, as expected, to an anemic 1.9%; and data from Europe and China has not been encouraging. A tough environment for stocks.
The Dow Jones Industrial Average (DJIA) fell 275 points (-2.2%) on Friday and closed the week down 2.7% to finish at 12,119. The S&P 500 fell 2.5% Friday and lost 3.0% for the week. The Russell 2000 and NASDAQ fell by similar numbers and closed down 3.8% and 3.2% for the week respectively. As bad as the weekly numbers were for the US indexes, it was not the worst weekly performance in 2012. That honor goes to the week ending May 18th. For the year, the DJIA is now in negative territory losing 0.8% and wiping out nice gains from early in the year. The S&P 500 is now up 1.6% for the year, the Russell 2000 is down 0.5%, and the NASDAQ is still holding onto a 5.5% gain in 2012.
Energy led all major economic sectors down last week losing nearly 5% as oil prices continue to fall sharply. Consumer Discretionary, Financials, and Industrials lost between 3% and 4% to be the next weakest group of sectors. The more defensive Utilities and Telecom sectors were the best performing sectors losing around 1%.

Europe continues to lead international markets down as the European Union (EU) comes under greater economic distress. According to Bloomberg.com, Spanish banks collectively lost €66 billion ($82 billion) in deposits further undermining the strength of the banking system there and increasing the urgency of a coordinated response by the EU and the European Central Bank (ECB) to shore up the banks. Unemployment in Spain jumped to 24.3% and the overall unemployment rate in the EU reached 11%. Industrial output is also falling across the EU to levels not seen in 3 years. The drop in employment and reduced economic activity is straining government treasuries adding to the severity of the debt crisis in that region. The MSCI (EAFE) index fell 2.8% last week closing out a terrible May in which the MSCI (EAFE) fell 12.1% and is now down 7.1% for the year.
The Euro fell another 1% against the US dollar closing Friday at $1.240. The Euro's weakness began in May losing 6.6% and is now down 4.5% against the US dollar in 2012. This is not surprising when the migration of cash from Greek and Spanish banks is taken into consideration. I believe a significant amount of that money is finding its way into US dollars and subsequently into US Treasuries. I also believe that the recent strength in the US dollar is due primarily to fear and because US Treasuries yield slightly more than German Bunds.
Commodities are in full retreat as investors fear a global slowdown and a stronger US dollar makes commodity purchases more expensive to international buyers. China reported last week that its manufacturing sector barely made gains last month causing investors to anticipate demand from this large, commodity-consuming, country to begin falling. This cannot be a major revelation because I think that with China's two largest trading partners (US and EU) struggling to get their economies going, demand for Chinese goods is likely to be reduced. WTI Oil fell $6.82 (-7.5%) per barrel last week to close at $83.90. WTI Oil fell a sharp 17.6% in May and is now down 15.1% for the year. Gold, in contrast, gained $62.30 (4.0%) last week as speculation about additional monetary easing by the US Federal Reserve surfaced following the poor jobs report Friday morning. The Dow Jones UBS Commodity Index, measuring a broad basket of commodities, fell 4.4% last week and is now down 9.9% for the year.
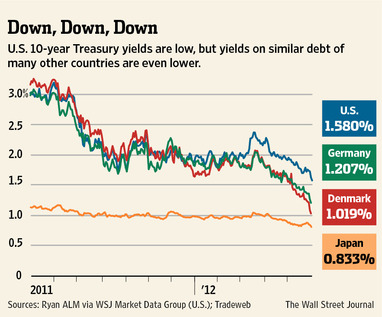
Bond markets returned to their winning ways after a slight hiccup last week with the Barclays Aggregate Bond Index posting a 0.9% gain. The real story is US Treasury interest rates. The US 10-year yield dropped sharply (prices increased) Friday breaking below 1.5% for the first time EVER to close at 1.454% The other Treasury yields also fell and investors clamored for the safety of US Treasuries. The German 10-year yield closed Friday at 1.172%. The rates in Spain and Italy remain nervously high at 6.53% and 5.74% respectively; however, they did stabilize somewhat last week. This move in interest rates has pushed long-duration bonds to the top of the list of best performing bond sectors while high yield, emerging market, and preferreds the weakest.
UNCERTAINTY IS IN CONTROL
By every measure, investors are abandoning stocks and looking for safety. People are afraid. Afraid Europe is going to implode, that the US is stuck in economic slow motion, that China is not going to ride in and save global growth, and there appear to be few prospects to change things.

I do believe Europe is an absolute mess. Governments over there have been living beyond their means, promising benefits to their citizens that will be impossible to deliver, and that leadership has failed to make meaningful changes that might result in economic growth even in the face of this collapse. Not that change would be easy. There are powerful groups that seek to preserve the status quo and that the economic conditions there will continue to spiral downwards as mounting debt begins to make lenders nervous. Nervous lenders in turn demand higher interest payments, which in turn puts more pressure on governments to cut spending to reduce debt, which slows economies further making it more difficult to meet interest payments, causing investors to seek even higher interest payments to compensate them for this additional risk. In this scenario private lenders will leave the bond market and will have to be replaced by the ECB. The question is will the ECB be willing or able to bailout Europe? Uncertainty.
US economic growth is not good. Spinning the news and hyperbole is in full force on both sides of the political aisle. It is an election year and every data point will be analyzed and dissected to look for any political gain to be exploited by either side. What is known is that unemployment remains above 8%, GDP growth is under 2%, federal debt is approaching $16 trillion, and there does not appear to be any solutions in sight-at least not until the November elections are concluded. Uncertainty.
Investors hate uncertainty. Or at least a lot of uncertainty. As an early mentor of mine said over a decade ago, "uncertainty provides opportunity-opportunity is lost with certainty." This means that now is the time to evaluate possible opportunities. You start by evaluating your current portfolio and look for individual investments that make you uncomfortable and making a decision to either hold on to them or sell. If you sell, you increase your cash exposure to step in and buy other investments that you may have thought were too expensive to buy before. I like buying things on sale. Also look at investments that have become very overbought. Today that is long-duration government bonds. Federal and municipal, and to a lesser degree corporates. Consider selling some of these rich investments to raise cash for future investments.
When will we know when the market has bottomed? That is hard to say precisely. Increased volatility is a sign. Investors who become fearful sell heavily. Investors who are repositioning their portfolios (as I described above) sell. This selling makes markets move downwards, sometimes sharply. However, when buyers step in, the New York Stock Exchange Bullish Percent (NYSEBP) will reverse course and help give insight about the bottoming process. Last week, the NYSEBP fell yet again to close at 45.06. This was the eleventh straight week of declines, and twelfth of the past thirteen. I will be watching this major indicator very closely. I will also be watching interest rates. If US Treasury rates begin to rise, I believe that will be a result of investors liquidating their positions to move their money elsewhere, most likely stocks.
Uncertainty is unpleasant, but do not let the opportunity pass without evaluating your current situation and taking prudent action for the future.
LOOKING AHEAD
I believe we are going to be subjected to more of the same next week. Europe will continue to drive most news stories. Efforts are underway by all parties to try and gain control of the situation. Do not underestimate the efforts of the ECB. They surprised most investors last December with the Long Term Refinancing Option (LTRO) which calmed very jittery markets, and they may be working on another liquidity option. There will be renewed speculation

about the US Federal Reserve implementing another round of quantitative easing. This early speculation helped push gold prices up sharply on Friday. The Wisconsin recall election will be held Tuesday and may be interpreted as an indicator of how the November elections could turn out--or at least the pundits would like to spin it that way depending on the outcome. Finally, I would remind everyone that the Supreme Court is anticipated to release their ruling on ObamaCare sometime this month and that decision may be a catalyst to the markets either up or down.
After a week full of critical economic reports, this week will be relatively quiet. The most significant event will be Fed Chairman Bernanke's appearance before the Joint Economic Committee in Congress discussing the economic outlook. This will come just after the weekly release of the Initial Jobless Claims report (consensus calls for a decline of 4000 claims from 383,000 to 379,000). The International Trade report will be released on Friday. Consensus calls for the trade deficit to shrink from $51.8 billion to $49.3 billion. This report will be watched very closely for signs of economic strength or weakness in exports. Import data, I believe, will be helped by the sharp fall in oil prices.
The major analysis provided by Dorsey Wright & Associates about the current status of the markets show that US stocks clearly remain the favored investment of the five major asset categories. Bonds have made a strong move in the number two spot creating separation from the other asset categories. Currencies, International stocks,and Commodities rank three, four, and five with International stocks and Commodities ranking below cash on a relative strength basis. Within the US stock asset category, mid capitalization growth stocks are favored as are equal-weighted investments over capitalization-weighted indexes. Among the major economic sectors, relative strength analysis favors Consumer Discretionary, Information Technology, and Real Estate.
The NYCE US Dollar Index is a measure that calculates the value of the US dollar through a basket of six currencies, the Euro, the Japanese Yen, the British Pound, the Canadian Dollar, the Swedish Krona, and the Swiss franc. The Euro is the predominant currency making up about 57% of the basket.
Currencies and futures generallyare volatile and are not suitable for
all investors. Investment in foreign exchange related products is subject to many factors that contribute to or increase volatility, such as national debt levels and trade deficits, changes in domestic and foreign interest rates, and investors' expectations concerning interest rates, currency exchange rates and global or regional political, economic or financial events and situations.
Investments in commodities may have greater volatility than investments in traditional securities, particularly if the instruments involve leverage. The value of commodity-linked derivative instruments may be affected by changes in overall market movements, commodity index volatility, changes in interest rates, or factors affecting a particular industry or commodity, including international economic, political and regulatory developments.
Emerging market investments involve higher risks than investments from developed countries and also involve increased risks due to differences in accounting methods, foreign taxation, political instability, and currency fluctuation. The main risks of international investing are currency fluctuations, differences in accounting methods, foreign taxation, economic, political or financial instability, and lack of timely or reliable information or unfavorable political or legal developments.
The Dow Jones UBS Commodities Index is composed of futures contracts on physical commodities. This index aims to provide a broadly diversified representation of commodity markets as an asset class. The index represents 19 commodities which are weighted to account for economic significance and market liquidity. This index cannot be traded directly. The commodities industries can be significantly affected by commodity prices, world events, import controls, worldwide competition, government regulations, and economic conditions. Past performance is no guarantee of future results. These investments may not be suitable for all investors, and there is no guarantee that any investment will be able to sell for a profit in the future.
TIPS are U.S. government securities designed to protect investors and the future value of their fixed-income investments from the adverse effects of inflation. Using the Consumer Price Index (CPI) as a guide, the value of the bond's principal is adjusted upward to keep pace with inflation. Increase in real interest rates can cause the price of inflation-protected debt securities to decrease. Interest payments on inflation-protected debt securities can be unpredictable.
As always, if you have any specific questions on your portfolio or wish to talk to me, please do not hesitate to call.
P.S. If you think this type of analysis would be of benefit to anyone you know, please share this communication with them.
Sincerely,

Paul Merritt, MBA, AIF ®, CRPC ®
Principal
NTrust Wealth Management
Past performance is not indicative of future results and there is no assurance that any forecasts mentioned in this report will be obtained. Technical analysis is just one form of analysis. You may also want to consider quantitative and fundamental analysis before making any investment decisions.
Information in this update has been obtained from and is based upon sources that NTrust Wealth Management (NTWM) believes to be reliable, however NTWM does not guarantee its accuracy. All opinions and estimates constitute NTWM's judgment as of the date the update was created and are subject to change without notice. This update is for informational purposes only and is not intended as an offer or solicitation for the purchase or sale of a security. Any decision to purchase securities must take into account existing public information on such security or any registered prospectus.
The bullish percent indicator (BPI) is a market breath indicator. The indicator is calculated by taking the total number of issues in an index or industry that are generating point and figure buy signals and dividing it by the total number of stocks in that group. The basic rule for using the bullish percent index is that when the BPI is above 70%, the market is overbought, and conversely when the indicator is below 30%, the market is oversold. The most popular BPI is the NYSE Bullish Percent Index, which is the tool of choice for famed point and figure analyst, Thomas Dorsey.
All indices are unmanaged and are not available for direct investment by the public. Past performance is not indicative of future results. The S&P 500 is based on the average performance of the 500 industrial stocks monitored by Standard & Poors, this is a market capitalization weighted index, meaning the largest companies in the S&P 500 have a greater weighting than smaller companies. The S&P 500 Equal Weighted Index is determined by giving each of the 500 stocks in the index the same weighting in the index. The Dow Jones Industrial Average is based on the average performance of 30 large U.S. companies monitored by Dow Jones & Company. The Dow Jones Corporate Bond Index is comprised of 96 investment grade issues that are divided into the industrial, financial, and utility/telecom sectors. They are further divided by maturity with each of the sectors represented by 2, 5, 10 and 30-year maturities. The Morgan Stanley Capital International (MSCI) Europe, Australia and Far East (EAFE) Index is a broad-based index composed of non U.S. stocks traded on the major exchanges around the globe. The Russell 2000 Index is comprised of the 2000 smallest companies within the Russell 3000 Index, which is made up of the 3000 biggest companies in the US.
Corporate bonds contain elements of both interest rate risk and credit risk. Treasury bills are guaranteed by the U.S. government as to the timely payment of principal and interest, and if held to maturity, offer a fixed rate of return and fixed principal value. U.S. Treasury bills do not eliminate market risk. The purchase of bonds is subject to availability and market conditions. There is an inverse relationship between the price of bonds and the yield: when price goes up, yield goes down, and vice versa. Market risk is a consideration if sold or redeemed prior to maturity. Some bonds have call features that may affect income.
Securities and Advisory Services offered through Commonwealth Financial Network®,
Member FINRA/SIPC, a Registered Investment Adviser.